
Sea-Level Rising 2 1/2 times Faster
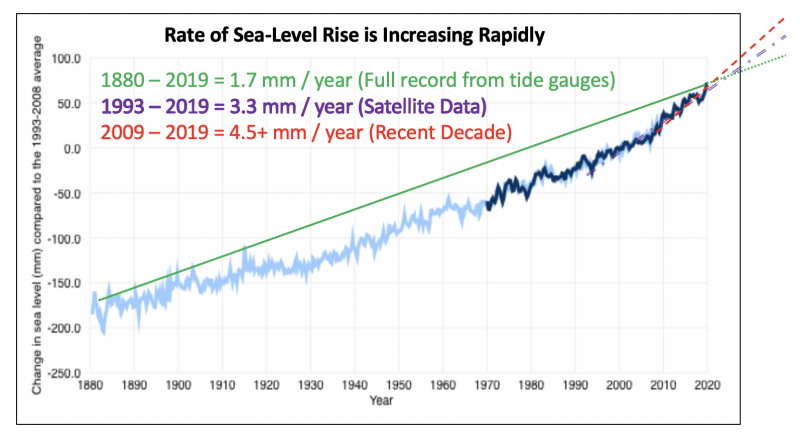
It may seem subtle, but the trending rate of sea-level rise (SLR) is powerful. Looking back over the last century and a half, the rate of sea-level rise has averaged 1.7 mm per year (seven hundredths of an inch) as shown on the green trend line. Starting back in 1880 the records were from tide gauges. Starting in 1993, sea level was measured much more precisely by satellites, shown in magenta. Over these last 27 years, the rate is 3.3 mm, almost exactly double the hundred fifty year average; quite significant.
In the last decade, shown in red, the rate is slightly over 4.5 mm per year. That is 2.5 times faster than the average for the last century. The rate and the tending change in rate may not seem like much, but like a drip filling a bucket, the effect is cumulative –– and the drip rate is getting faster. (BTW, the increased rate of rise is supported by the increasing rates of ice melting on Greenland, Antarctica, and the thermal expansion of seawater.)
I understand that graphs can be complicated and a put-off to many. Some of the simplest and easiest graphs of rising sea level are on two U.S. Government websites, one run by NOAA and the other by NASA. Both are interactive, allowing users to easily and graphically change the horizontal scales. I highly recommended checking them out, particularly for teachers and students.
- https://climate.gov/news-features/understanding-climate/climate-change-global-sea-level
- https://climate.nasa.gov/vital-signs/sea-level/
If you have been reading my blog for a while, you may recall a prior post from early last year with a similar point. It described a rapidly increasing rate of rise as part of a challenge teaser, “How Long to Fill a Soccer Stadium with Water?”
Sometimes I think we make the science more complicated than it needs to be. The planet is warmer and getting more so by the decade. On a warmer planet there will be less ice. The sea will be higher, pushing the shoreline inland. This brings to mind the “KISS Principle” — Keep It Simple Stupid. Though not easy, at the simplest level, we need to do three things, simultaneously:
- Slow the warming ASAP by reducing greenhouse gas emissions.
- Be more resilient to tolerate the “new normal” on a warmer planet with more droughts, rain, fires and extreme weather.
- Begin to adapt to those features that cannot soon be halted or reversed, with rising sea level being the prime example.
It all starts with the right concept and understanding. The right simple graphic can help to see things clearly.