New Free Flood Risk Model for All U.S. Properties
FEMA flood map compared with new FLOOD FACTOR free App from First Street Foundation
Even I was surprised that yesterday’s news headlines included a story about a new flood risk model. From the New York Times, across the media landscape there was a feature about better flood risk data. It was strong evidence of the growing awareness of the problem of increased flooding from multiple causes. The nonprofit First Street Foundation, had released the next generation of their elegant and simple flood model, now rebranded as “Flood Factor.”
This is the latest update of the product I described here in a blog post “U.S. Flood Risk Tool Super Easy” on March 2nd, when it was called “Flood IQ.”
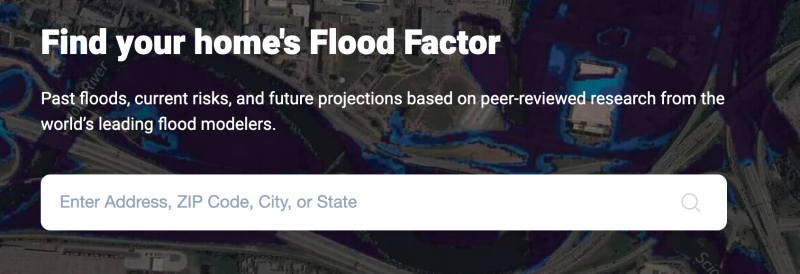
It is brilliantly simple. Right on the home screen, type in any U.S. street address. http://www.floodfactor.com
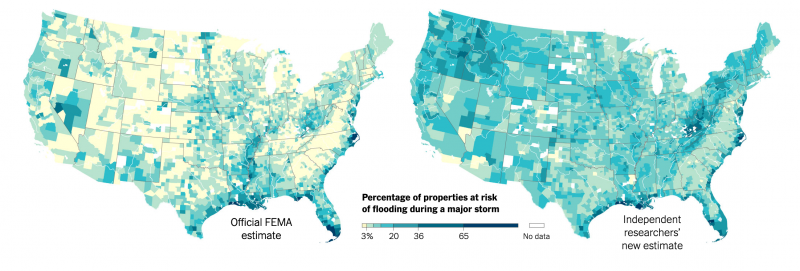
Besides the simplicity and the fact that it is free to use, the key point is that their analysis raised the number of U.S. homes vulnerable to flooding from 8.7 million according to FEMA, up to 14.6 million – a 36% increase. In Chicago, for example, their method shows 75,000 more homes as vulnerable to flooding than the U.S. Government information.
This version claims to cover all US properties, not just coastal. According to their explanation, they are using high resolution lidar maps, getting down to 10 foot (3 meter) resolution; their models are more sophisticated, taking into account topography, rainfall, and riverine flooding, and in coastal areas, storm surge, extreme tides, and sea level rise.
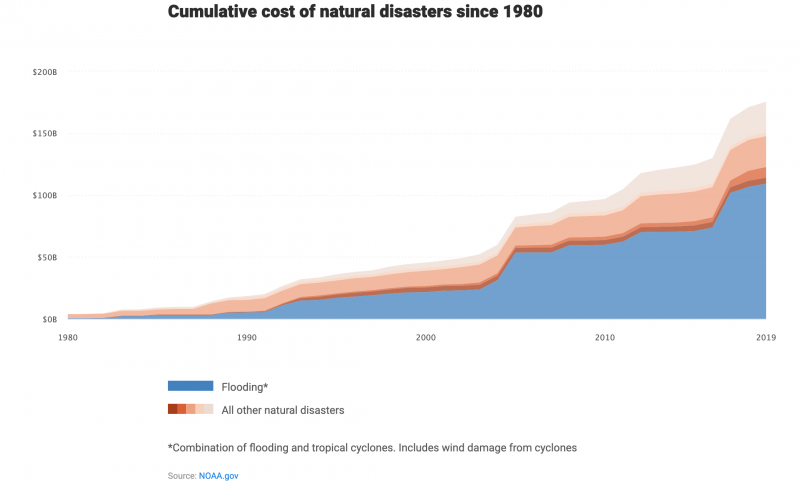
Flooding is the greatest source of property damage as illustrated on the graph below. Heavier rainfall and rising sea level are prime factors. As the planet continues to warm, putting more moisture in the air and melting the polar ice sheets, we can expect the trend to continue. It should reinforce the need to get off fossil fuels. But regardless we are vulnerable to worse flooding in the years ahead. No models are perfect, but this appears to be a big step forward in terms of methodology and elegance of the interface. For those wanting to dig deeper, by state, cities, and methodology, there is copious information on their website. It’s best just to let them speak for themselves. Go to www.floodfactor.com