
There is some confusion about the relative contributions to global sea level change. This is a short clarification of that, mostly to respond to a particular reader of my blog posts, but perhaps a few other readers will find this helpful. It is technical enough that I do NOT intend to make this a public post as I find there is a fine line of getting too technical, “turning off” most readers — and suspect this is ‘over the line.’ I will try to make the case with a few graphics, sourced as noted:
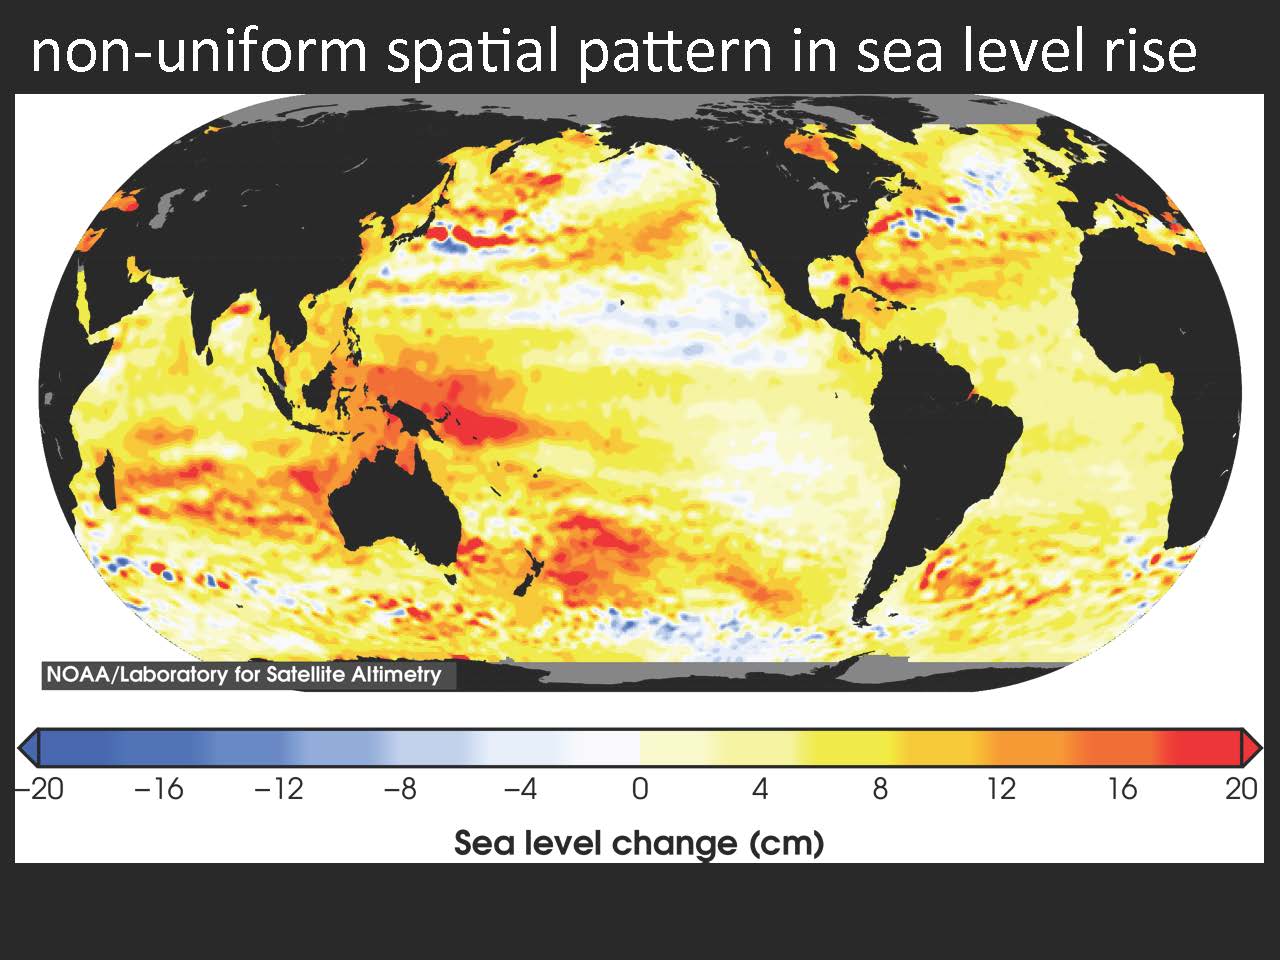
As a starting point we need to recognize that sea level change varies by location due to vertical land movements, ocean currents and temperature changes globally as illustrated in this colored map below. So, unless noted specifically, we are talking about global mean (average) sea level (GMSL) in the following notes.
The primary issue here is to compare the contribution of the thermal expansion of seawater from the warming temperature to the contribution from ice on land both in the form or meltwater and new icebergs. The following illustrations from the “SWIPA” Report, Snow, Water, Ice and Permafrost in the Arctic (SWIPA) are good illustrations of the RELATIVE CONTRIBUTIONS from the period 2004-2010, the latest period for which they have a full data set.

Projecting forward and backwards, they even do an interesting visualization of how the relative components change over time, though as I will explain in a moment, the projected future components may very well understate the contribution of Antarctic Land Ice, substantially changing the ratios or percentages of contribution.

The challenge in all this is the dynamical change in the rates of melting on Greenland and Antarctica. There are two ways to look at this from my perspective:
- Thermal expansion of seawater is relatively quick to reflect the warming temperature, since it is a direct result of the density of water. In other words, there is little lag time as the oceans warm, for that to manifest as thermal expansion of seawater, showing up as higher sea level. In sharp comparison, the melting of the ice sheets and glaciers on land, has a big lag time and is not even consistent. The miles of ice covering Greenland and Antarctica add to sea level as the meltwater flows change, as icebergs calve, and as the glaciers go through rapid, unpredictable phases of collapse. (For more, look up Marine Ice Sheet Instability (MISI) and Marine Ice Cliff Instability (MICI).
- The big “black box” in all this is how Antarctica will collapse/melt. In the above graphic, the light blue component is Antarctica. Even that projection almost certainly understates the future contribution. No knowledgeable glaciologist believes that the potential or even likely contribution from Antarctica is represented by that line. The problem is how to quantify an uncertainty. The root research for a lot of this is the UN-IPCC. Even that document, the latest “5th Assessment” essentially omits out the potential contribution from large dynamic changes to Antarctica, only because it cannot be specifically quantified to their own protocol. But not being able to quantify a risk does not mean it is not real. I.e. we may not know how much of Antarctic will melt and slide into the sea by the year 2100, but that does not suggest it will not occur. As a metaphor, we may know that conditions favor a mudslide or avalanche, yet there is no way to know when or even if it will happen. For more see https://johnenglander.net/wp/ipcc-ar5-table-13-5-reformatted-stacked-bar/
As a result of the above, it is unrealistic to accurately project future percentages of thermal expansion, versus meltwater and icebergs from ice on land. To be clear, looking back over the last century, thermal expansion accounted for a majority of GMSL. In the period graphed above, almost a decade ago, it accounted for 45%. My hunch is that today it is considerable less as a percentage, perhaps one third of the total contribution. Even if thermal expansion increases as the warming accelerates, the contribution of Antarctica will very likely increase more quickly. (For more see, Elephants of Antarctica and Greenland.)
Depending on one’s assumptions about our ability to slow the warming, we may reasonably project the amount of thermal expansion of seawater. Projecting the amount of contribution of SLR from Antarctica is much more vague for the coming decades. Recent observations support that things are changing quickly.
As a result, using the relative proportions from 2004-2010 are not useful for the present day — 2018 — and certainly of limited value in looking ahead to the next few decades, let alone 82 years, to the usual horizon of 2100. Within the next two to four years both SWIPA and the UN-IPCC will publish updates, that may provide better insight. Regardless, the challenge to project sea level with the highly dynamic changes to the ice sheets on Antarctica will remain a problem. Percentages of contribution are of little value except for a very specific time interval, which needs to be specified.