
The Connection: Sea Level, Global Warming, and CO2
From “High Tide on Main Street: Rising Sea Level and the Coming Coastal Crisis” – Englander (Graphic based on Hansen / Sato)
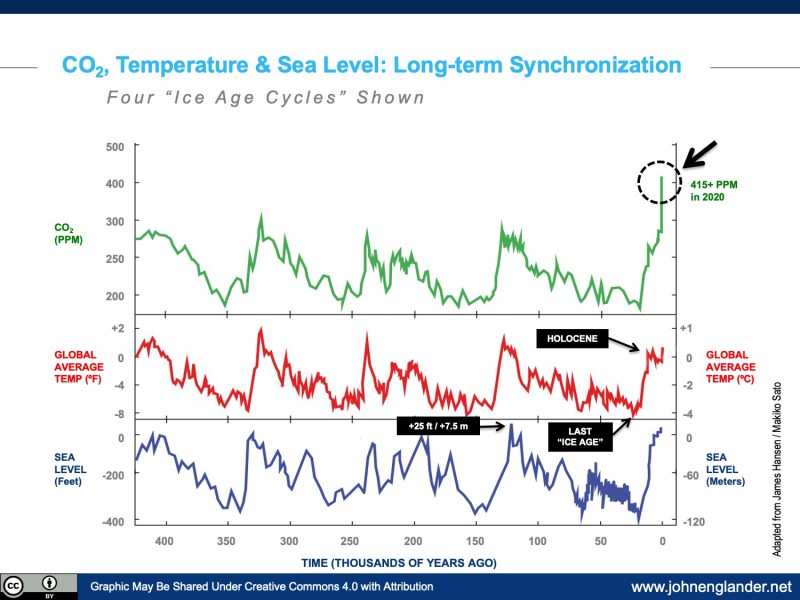
Over the long term, global sea level, global average temperature and the level of carbon dioxide (CO2) move together – in synchronization. When there is a shift in long-term average global temperature the polar ice sheets increase or decrease in size. Over decades of warming, the ice sheets get smaller and sea level rises. The opposite is true as well. It takes decades, centuries, and millennia for the adjustment to fully equalize when there is global temperature change. In common use, the cold eras, like the one 20,000 years ago are referred to as an “ice age.” The chart above shows 4 full cycles with a warming and coooling phase, each lasting roughly 100,000 years. The blue line is global average sea level. The red line is global average temperature. The green line is global carbon dioxide (CO2) level – described as a greenhouse gas. Though I have shown this chart previously it has now been updated and is worth sharing again. Many readers tell me it is the single best image, from which to understand climate change. You are welcome to copy and use this image.
There are several important points to observe and understand:
- The recent relatively stable climate era of 11,700 years is referred to as the Holocene. This period would have been the turning point, or plateau, as the earth went from the approximately 20,000 year warming period into the next 80,000 year natural cooling phase. These roughly hundred thousand year cycles were obviously natural. They have been occurring for 2.58 million years. If the chart was extended back the full two and a half million years, the synchronized three lines would keep the same pattern. The cause of this natural ice age pattern is Earth’s elliptical orbit around the sun, changing our distance from the Sun and the amount of heat energy by about one percent. In effect these natural warming and cooling periods are like a super summer and winter. (The cycles are referred to as the Milankovitch cycles if you want to learn more about them.)
- With each “ice age cycle” as they are commonly called, global average temperature swings 9 degrees Fahrenheit (5 degrees Celsius) warmer and colder, and sea level moves up and down almost 400 feet (~120 meters).
- As the atmosphere changes temperature, the ocean slowly follows. It can take almost a thousand years for the oceans to fully reach a new equilibrium temperature. When the oceans warm, they release carbon dioxide as can be seen in the way that carbon dioxide (CO2) follows global average temperature. That oceanic release of CO2 shows up as increased levels in the atmosphere. You can see that the level of CO2 ranged in a pattern from 180 – 280 ppm (parts per million) throughout this 400,000 years. Obviously, until recently that was natural — not caused by human influence.
- About two hundred years ago, when we began burning fossil fuels in greater and greater quantities, it changed the amount of carbon dioxide in the atmosphere, dramatically. Note the circle in the upper right of the chart at the end of the green line – CO2, which now shows as a vertical upward line on this scale chart. The vast burning of fossil fuels correlates well with this rapid increase in CO2 level. The latest measurement is 415 ppm, 40% higher than in the last few million years. It was demonstrated two hundred years ago, that carbon dioxide had an amazing effect to trap heat, even though it is absolutely invisible. It came to be known as a greenhouse gas due to its property to trap heat like the roof of a greenhouse. So, rather amazingly temperature and carbon dioxide will move together though either one can lead the other.
- During the industrial era, Earth has warmed about one degree Celsius, which is 1.8 degrees Fahrenheit. The global goals are all stated in Celsius. You have likely heard of goals to keep the total warming to 1.5 degrees or 2 degrees. On our current path, unless we make some big changes in the next decade, we are headed to three or four degrees of warming.
- Because Earth is now warmer due to the effect of humans, we have broken out of the natural ice age cycles. Rather than starting the slow cooling era into the next ice age, we have now broken out of those natural cycles and into a new era of super warming. The human driven warming “force” is about eighty times stronger than the natural cooling force.
I offer this graphic as one of the simplest ways to communicate two things. 1) that current “global warming” was triggered by humans and is a sharp departure from the natural climate change cycles, and 2) that sea level is going to rise for a long time, due to the temperature and CO2 level being far above normal. The warmer the temperature, the more the ice sheets melt, pushing sea level higher.
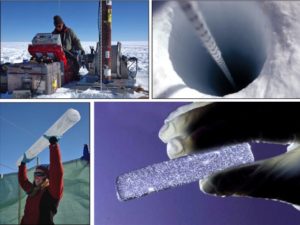 For those interested in how we could know these numbers, CO2 levels and historic temperatures are derived from ice cores. Somewhat analogous to the scientific study of coring into tree rings, this relatively new technology allows us to analyze the content of microscopic bubbles of air trapped in the 800,000 year old ice sheets on Antarctica, and the 130,000 year old ice sheets still on Greenland. See image at the right. These fascinating, precise analyses are done by scientists from a variety of nations and universities and are now well validated. Ancient sea levels are determined by physical evidence such as ancient shoreline now submerged, or by a detailed analysis of marine sediments now above sea level.
While there is a lag time or relatively slow response to the skyrocketing level of greenhouse gases, temperatures are rising and sea level is rising and accelerating as the ice on land at both poles melts faster and faster. Back to the chart, looking back to the last warm point about 120,000 years ago – in a period referred to as the Eemian – sea level reached a height about 25 feet (7+ meters) higher than present. Given our speed of warming and melting, we will most likely see even higher sea levels in the coming centuries.
“We” must do two things simultaneously and AS SOON AS POSSIBLE: 1) Work to reduce the greenhouse gases and the warming, and 2) Begin preparing for higher sea level. With the latest government projections of up to eight feet of sea level rise this century, we have no time to waste.