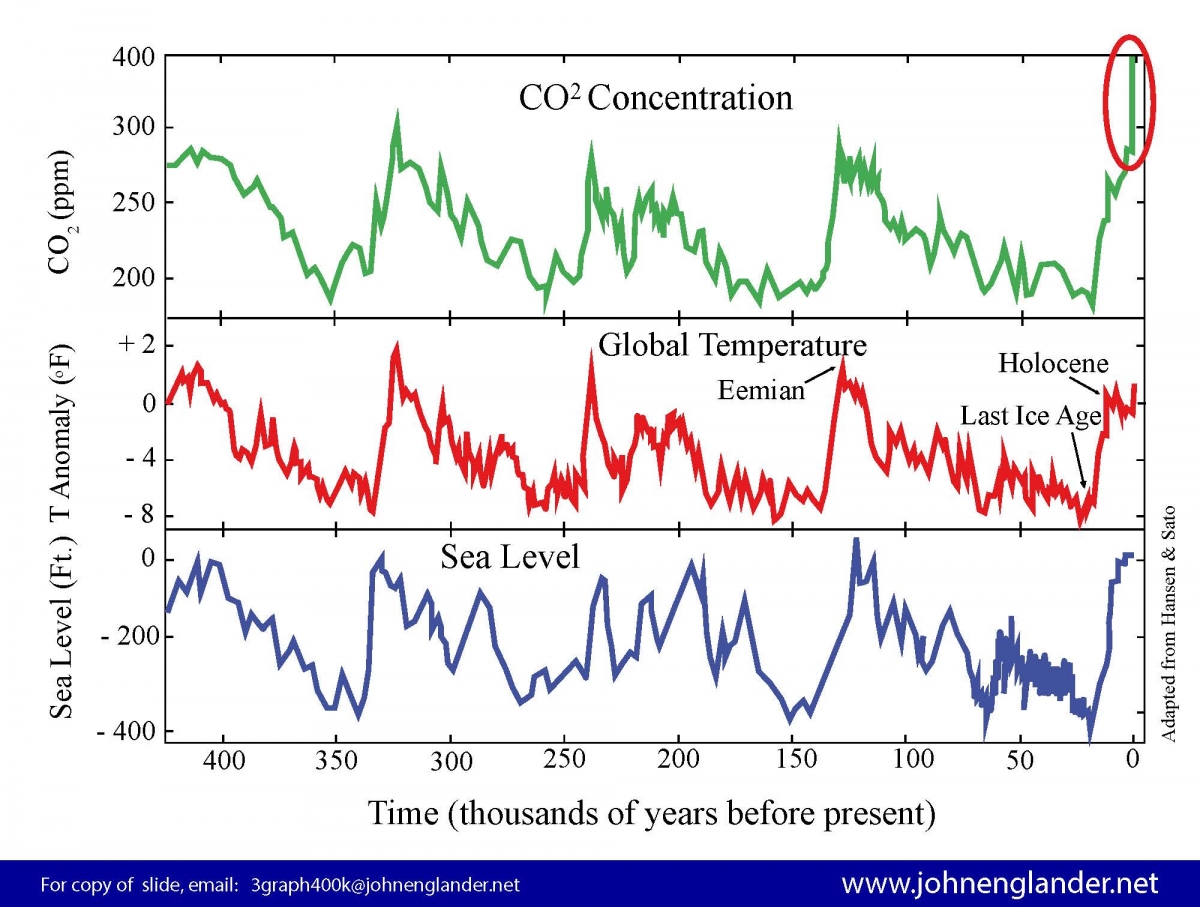
420,000 years of Temp, CO2, and sea level – What a Coincidence
This chart shows the relative changes in global average temperature, CO2 (carbon dioxide), and sea level over the last 420,000 years. The data is derived from different sources that corroborate and confirm the findings. Data sources include air bubbles trapped in layers of the ice ...
October 2nd, 2016 Category: Sea Level Rise

