Why Sea Level will Rise for Centuries; ultimately 100 feet +

Just 4 illustrations show why sea level will almost certainly rise for centuries, the STUNNING levels of historical change; and even why society generally doubts that it will ever happen. Articles about sea level rise (SLR) somewhere on the planet are appearing almost daily. (I track this stuff for my forthcoming book “High Tide on Main Street”.) I am glad to see at least this modest increased awareness about a HUGE problem.
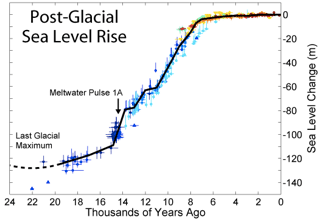
The chart to the right shows sea level change over the last 24,000 years, taken from the geologic record. It is in meters, the standard measurement in science. (For approximate # of feet, multiply by 3.)
There are 4 things to note:
- Less than 20,000 years ago the ocean was down almost 400 feet below the current sea level. A HUGE change in sea level, and not that long ago. This is based on geologic records that have been known and taught for the better part of a century.
- Nearly all 130 meters of rise (400 feet) happened between 20,000 years ago, at the peak of the last ice age, and about 6-8 thousand years ago; in other words over about just 12,000 years.
- For about the last 6,000 years, sea level has hardly changed at all. That is about the age of our earliest written records, and more or less the span of human civilization. No wonder that we believe sea level to be rather fixed in place.
- It is also worth noting that about 14,000 years ago, long before any human impact, that the ice sheets melted quickly, causing what the geologists call a ‘meltwater pulse.’ The ocean rose about 65 feet in just 4 centures, averaging more than a foot a decade — hard to imagine! (Might that sudden rise be the basis for stories of the biblical flood, or Atlantis?)
Amazingly, sea level has regularly cycled up and down about 120 meters, or almost 400 feet on a regular cycle, pretty much every 100,000 years. That has been going on for at least 2.7 million years. If you want to see the chart showing that pattern, look back at my last post “SPIEGEL missed Explaining wide range of 3-16 feet of SLR forecasts”; the lower yellow/blue graph there shows an expanded view of the last 140,000 years of sea level, and a larger view of more than 800,000 years. (Again, the vertical scale is in meters, so for those who use feet, MULTIPLY BY 3, approximately.)
While that huge cycle of sea level change is likely very surprising, it ties into something you likely do know about: the ice ages, when North America and Europe were regularly covered in ice more than 3 km (2 miles) deep. As the ice melted, the water flowed into the sea, raising the level of the ocean. As the sea level changes, of course, the shoreline moves — a LOT. Not only can scientists calculate the thickness of that ice and how much water would have been added to the ocean, but we can actually see very distinct ancient beaches and shorelines now more than 300 feet underwater, as further proof. I have personally seen them from research submarines; there is no question that sea level changes.
Scientists look for causes, relationships, and corroboration to prove hypotheses (theories). With temperature, CO2 (carbon dioxide) and Sea Level, the historical records of geology fit together neatly.
Temperature in the atmosphere correlates almost directly with the amount of CO2, due to a principle of basic physics and chemistry. Long before Al Gore, it was proven that CO2 was colorless, and transmitted light VERY well, but that it trapped heat VERY WELL too.
Today we call that the greenhouse effect, as it describes how a glass greenhouse enables keeping warmer temperature in a colder climate. Glass has those same properties as CO2 gas.
As the planet warms, the ice sheets melt, raising sea level. As this chart shows (courtesy Hansen and Sato) three things move in close synchronization. Temperature in RED, CO2 in GREEN, and sea level in BLUE, for the last 420,000 years.
The problem we face becomes apparent when we look closely at the green line for CO2 (think “greenhouse gases.” You should be able to see that the green line goes way up into the Red graph, like a rocket, and corresponds to such things as the coal and petroleum that we have burned over the last century.
We have to note that these graphs showing hundreds of thousands of years, compress the horizontal time scale. It is not possible to see a specific year, or even a decade. Even a century would be a speck, when the smallest division on the graph at the left is 50,000 years. But it does show a “big picture” with GREAT clarity. What you can’t tell from such a graph is how many years temperature and CO2 changes might lag each other. (And interestingly, sometimes one leads, and sometimes the other. That’s worthy of a separate post.)
The fact is that we don’t know how quickly temperature will follow the vertical line of CO2 increase. That is the extremely important question that different teams of scientists are trying to figure out with supercomputers — to project how quickly our atmosphere and ocean will warm as CO2 levels continue to increase.
CO2 is now at 400 ppm (updated 2014); about 40% higher than at any time in millions of years. It ranges from about 180 – 280 ppm with each ice age cycle as shown in that 3 line graph above. (For the latest actual number, see the little blue graphic in the right hand column of my home page.)
Just two more images wrap up the sea level story.
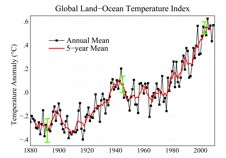
The oceans and atmosphere have warmed globally over the last century. This is the 130 year reconstruction of the average annual land-sea temperatures over the entire planet. It shows a change from a low of almost minus 0.4 from a norm, to a positive 0.6 — just under a degree Celsius over the 130 year graph, or about 0.8 degrees C (about 1.4 degrees F) over the last century.
So we already have most of the pieces of the sea level puzzle.
- Sea Level has changed repeatedly by almost 400 feet.
- It logically goes up and down, in opposite direction of the changing ice sheets over the last 3 million years
- The ice sheets slowly adjust to global mean temperature, which follows CO2 levels in close parallel.
Got it? CO2; average global temperature; ice sheets, and sea level are all locked together in a physical relationship.
The last correlation is a stunner; at least it stunned me, when I stopped to let it sink in.
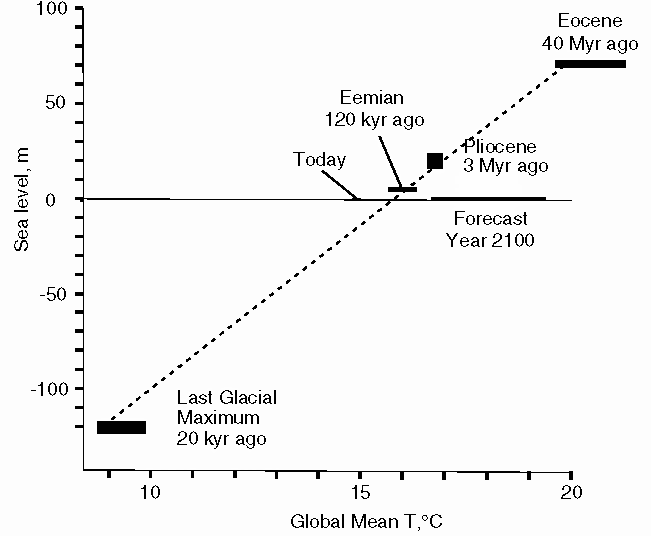
Dr. David Archer, an eminent scientist (and author of THE LONG THAW) looked at the work of another eminent glaciologist, Dr. Richard Alley, and produced the simple graph at the left. It plots a few known ancient sea levels against ancient temperatures. Admittedly the numbers are approximate.
It graphs 5 different points of historic sea level: 40 and 3 million years ago, 120,000 and 20,000 years ago, and the present day.
They fall reasonably on a straight line, which is what is expected if the amount of ice on the planet will change proportional to the average temperature on the planet. It cannot predict how quickly the adjustment will happen. (It might help to understand that 200,000 years is considered a “brief period” by geologists.)
What is stunning is the angle or correlation of the graph trend line. It indicates that with each degree C of change in the global mean temperature, that sea level changes by about 20 meters (65 feet). Just think about that; and recall that we have already had almost a degree of warming over the last hundred year, with lots more on the way. The current forecast is for a MINIMUM of 2 degrees C warming by end of century and most models show that we will get 4-5 degrees C, if we don’t take drastic steps to reduce greenhouse gases very soon.
Again, it could take centuries for that amount of ice melting to happen. The long periods of ice formation and melting happen over thousands of years. We are now definitely in a warming period as proven by the shrinking glaciers and melting Arctic ice cap, and the Greenland ice sheet. It is predicted that the Arctic Ocean will be ice free, some time in about two decades. That has not occurred for at least 7,000 years and perhaps not in the last three million years. The added greenhouse gases are warming the planet’s temperature above the usual top end of the ice age cycle.
According to the pattern of last three million years (shown on that previous blog post) we would have started the long cooling phase towards the next ice age. Instead, we are warming. If we melt all the ice on the planet( which has happened before, but not for about 40 – 50 million years), then global sea levels would be approximately 80 meters (265 feet) higher than today. That would swamp every coastal city. What we do not yet know is whether that will take hundreds of years, or thousands, on our present course of adding to the greenhouse layer. Presently the forecasts for this century range from as low as a meter (3 feet) of SLR, to as much as 5 meters (16 feet). There are two reasons that scientists cannot yet accurately predict how fast the ice will melt.
First, the geologic record is not accurate down to the level of individual years, or even decades, and centuries, as mentioned above.
The second challenge is that we are now warming MUCH faster than during previous periods of abrupt climate change. According to our leading climate scientist, Dr. James Hansen, the Earth has warmed 20,000 times faster over the last century, than during the abrupt change 65 million years ago, when the dinosaurs were wiped out, (likely as a result of an asteroid impact). While the cause of that mega extinction was different than the present situation, the rate of warming is the relvant comparison that he makes.
In other words. because the current warming, caused by the rapid rise in greenhouse gases, is happening 20,000 times faster than in nature, it is hard to say how fast the ice will melt, and the ocean will rise. There is no accurate precedent. But the models are getting better rather quickly, due to increasingly accurate measurements of how the ice is actually melting.
What the latest models do show is that sea level will continue to rise for at least 500 years, even if we stopped all CO2 emissions immediately.
While that 500 year lag time may seem surprising, the earth’s systems move slowly, like changing course or stopping a big ship. One of the reasons that heat and ice melt will not stop for at least 500 years is that it takes up to 700 years for the oceans to fully change temperature, due to the fact that the oceans’ average depth is a few miles/km, and goes as deep as 35 thousand feet (12,000 km). The heat layers segregate, slowing change to a new surface temperature.
In effect, the ocean acts like a giant storage battery for heat. It has absorbed most of the extra heat, trapped by the greenhouse gases. That is a key reason that the ice will melt, and the oceans will rise, for centuries, or longer.
What we do over the decades ahead will slow or increase the rate of warming, and the rate of sea level rise. and can make a big difference for generations to follow.
– – – –
If you have found this helpful, please share it. If you would like me to explain any aspect of the above further, please leave a comment.
Thanks.


