
AUSTRALIAN article on slowing SLR gets ‘Stupid Story Award’
A story today in THE AUSTRALIAN is a good candidate for my Stupid-Story-of-the Week-Award. Their headline is:
“Sea-level rises are slowing, tidal gauge records show”
This is bad journalism in terms of not putting things in perspective, fueling misunderstanding. The article describes an Australian scientist Phil Watson, who recently published a peer-reviewed article in a science journal — a very GOOD qualification for a story, by the way. It explains that Waston analyzed tide gauge records for Australia showing that the rate of rise on that continent, has been SLOWING down, rather than accelerating as many scientists have described for global sea level. Fair enough, as far as Watson’s paper goes in a scientific journal. That finding is worthy of scientific review, but extremely misleading on its own.
The impression The Australian creates however, is that his finding totally undermines the measurements of accelerating rise reported in the press, and used by the scientific community as a basis for projecting more sea level rise (“SLR”) in the future. Obviously, this would be reasonable if there was not good information to put it in perspective, or at least to explain the apparent inconsistency. Fortunately, there is.
 There are two basic sets of incremental measurements of sea level, from which we can deduce rates of change. One is from physical tide gauges all over the world; many have been in place for more than a century. They are fairly accurate. The big issue is that they measure, RELATIVE TO THE land where they are installed — more on that in a moment.
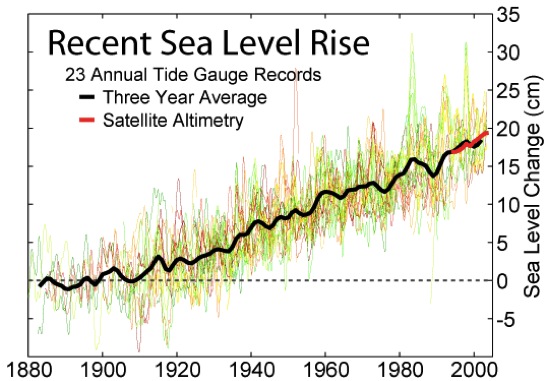
The other method of measurement is satellites, that get to scan the entire globe daily, down to fractions of a millimeter. The measurements from the tide gauges and satellites correlate FAIRLY well, as shown in this graph.
The RED is the satellite data, that only goes back a few decades to their start. The black is the 3 year mean of 23 global gauges going back to 1880 — 130 years. The other thin colored lines (green, yellow, etc.) are the different tide gauges. They vary quite a lot. A good picture only emerges from the global average.
Besides inaccuracy of a mechanical gauge based in the ocean (think corrosion, barnacles, algae, etc.) why would a tide gauge give data that misrepresents? The important answer has to do with the place it is located.
Landforms move. Upward is called UPLIFT. Downward is called SUBSIDENCE. For example North America is moving upwards a fraction of an inch each decade as it recovers from the weight of the two mile sheets of ice that melted about 15,000 years ago. New Orleans is moving downward due to a) compacting silt from the Mississippi delta, and b) the extraction of so much water from shallow depths, and oil from deep depths, that the land is compacting.
The movement of the land, has to be adjusted when one looks at sea level from any coastal location. We know the oceans are rising due to the melting ice sheets and the expansion of seawater as it warms, even slightly. That is measurable, and even the bad journalism in the AUSTRALIAN does not dispute that; they are focusing on the apparent slowing rate of rise.
As a good example of how the movement of land masses affects the APPARENT rate of rise — in Alaska, sea level is actually dropping. The reason is that their land mass is rising at a rate faster than sea level.
Why would Australia be uplifting? Hard to say without an honest scientific look at the issues. One possibility however, is that that part of the earth’s crust could be uplifting. Recall that we have had seismic activity from New Zealand to Japan. Volcanism does cause bulges. For example, at Yellowstone National Park, the dome is moving upwards by inches a year; actually visible to observers. Something similar, could be happening to Australia. You would only see that in the satellite data however, not from tide gauges.
IF the AUSTRALIAN wanted to inform, to educate, rather than to fuel doubt, they would have explained about the limitations of tide gauge data, land uplift, and satellite data. To look solely at local tide gauge data from one region is myopic, ignorant, or misleading — take your pick. Bad journalism. Were they being careless, or trying to make you doubt the vast majority of climate scientists? Hmmm…
For a similar example of a misleading story on FOX news see my earlier post. For a clear explanation with 5 illustrations that explain why sea level will undoubtedly rise, see “Why Sea Level will Rise for Centuries; ultimately 100 feet +”
If this was helpful to you, please consider sharing. Comments and questions welcome.
Thank you.