
9-Box Matrix – New Flood Design Guidelines
Last week I talked about the Institution of Mechanical Engineers (British) new report which incorporated flood design guidelines they refer to as the “Englander 9-Box Matrix.” I want to dive a little deeper to explain this simple, yet radical new approach to flood design guidance. Adding the above graph is probably helpful too.
Up until now, most everyone has been trying to design and engineer in coastal areas, based on knowing exactly how high water levels will get. However, rising sea level is impossible to accurately predict, due to the unpredictability of precisely how the mile-high ice sheets on Antarctica and Greenland will melt over the next century. In addition, we are getting record-setting floods from storms, extreme tides, and unusually heavy rainfall. It is now quite common to hear of “hundred-year floods” every few years.
The 9-Box Matrix – shown below – deals with these uncertainties in a totally new way. It takes all the highest projections, including the extreme glacier melting scenarios, and then rounds them upward, adding a substantial margin of safety. They are just approximations, but with safety built in.
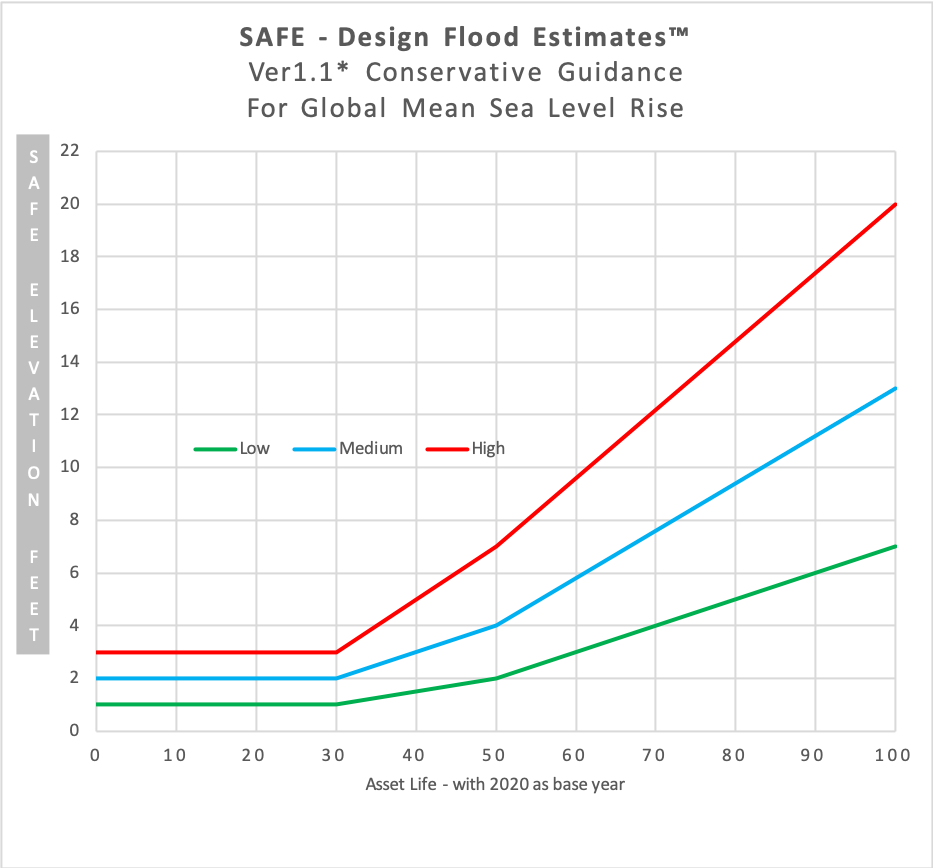
- In the matrix, the three columns are for 30, 50, and 100 years, again just roughly based on 2020 as a baseline. In other words they look out to 2050, 2070, and 2120 — more or less….
- The three rows are for low, medium, and high risk sensitivity. Good examples might be planning a soccer field versus a nuclear power plant. In the graph, the 3 lines, green, blue, and red depict the low, medium and high risk sensitivity.
For safe design and engineering, there should always a margin of safety, and generally, there is. For example, with a roof truss, or a bridge, the engineering is never done to the actual load requirement. Often it is double or quadruple what the calculated load suggests.
But with designing for future flooding, nearly everyone designs just above the projected water level, with a negligible margin of safety. Given that the glaciers and ice sheets will melt for centuries, and are acclerating, that’s crazy. Due to the essentially unstoppable aspect of rising sea level, due to the excess heat already stored in the sea, we need to recognize the new reality that sea level will move higher for a very long time. (Hopefully, robust effort to reduce carbon dioxide levels will eventually slow the rate of rising sea level.)
Note that for the first three decades in the graph, the lines are horizontal, since we don’t expect abrupt sea level rise that soon. One, two, or three feet (roughly a meter) should give a good margin of safety for a few decades. Starting about mid century, however, projections for potential sea level rise, turn upwards, covering the growing possibility of substantially higher base sea level
While I am sure there will be great resistance from many, the 9-Box Matrix could help professionals in the built environment plan better, taking in account both the risk sensitivity and the asset’s design life. Though many projects have a design life of a few decades, it is now common for buildings and infrastructure to have useful lives of a hundred years – or more.
The table and the graph will be updated regularly at: https://risingseasinstitute.org/englander9boxmatrix/ If you know someone who might find this useful, please share.
Suggestions for improvement are welcome: info@risingseasinstitute.org