
What is Sea Level ? — on the level
 Today there was a flood of twitter chatter about the meaning of “sea level”, though a good explanation will not fit in 140 characters. (Such questions often get directed to me due to the title of my book, “High Tide On Main Street: Rising Sea Level and the Coming Coastal Crisis.”)
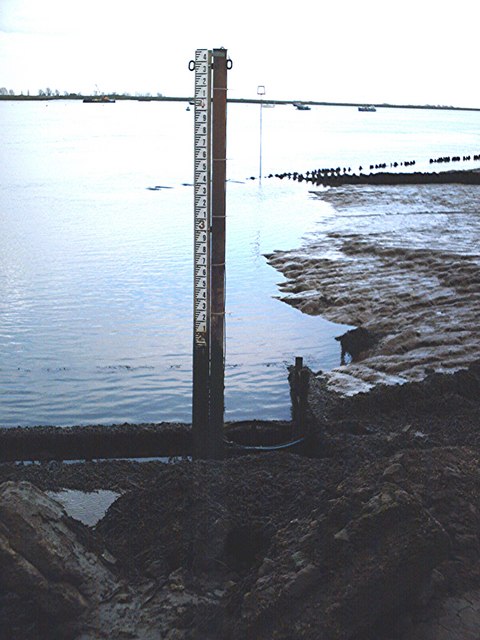
Typically “sea level” refers to the AVERAGE MEAN SL, essentially the mid point between the daily high and low tides heights. Daily sea level will vary from place to place, but roughly 3 feet or a meter is a reasonable approximation of NORMAL tide variation. When the moon and sun are in alignment every 28 days, pulling more strongly on the oceans, the global ocean bulge is higher, meaning an even more extreme tide, sometimes called ‘full moon high tide’, ‘spring tide’, or ‘king tide.’ But it’s a little more complicated than that.
The lowest sea level is the “low tide” or Mean Low Water. It defines what is permanently underwater. High High Water is the highest recorded routine high tide over a 19 year lunar cycle, and is of concern in keeping coastal structures out of the water with the monthly tide cycle. In addition, everyone realizes that unpredictable storms can cause higher ocean levels temporarily. If a storm hits at high tide, or even a king tide, the water will get even higher — as when “Sandy” hit New York City. In terms of preparing or designing a house or structure to be above water level, we have to decide what scenario we want to plan for, presumably the ‘worst case’ with a margin for error.
Numerical heights “above sea level” typically are in relation to some reference point or “datum” and not to actual SL. For example, in the UK the reference datum comes from a place in Cornwall back in 1921. In France it was in Marseilles. Others refer to Amsterdam. More recently since the global satellite data starting in 1992 there has been some international consistency to measurements. But contrary to common sense SL is not the same everywhere. The fundamental issue is that the Earth is not a sphere. It’s shape and mass have a lot of irregularities. Seawater is attracted to “mass” whether that be the rotating moon and sun, or a dense heavy mass within the Earth, such as a huge iron deposit. In fact SL height can vary hundreds of feet, from ocean to ocean, though we can’t discern that on the scale of what we can see.
Also, sea level has been rising faster in recent decades, primarily due to the addition from melting ice sheets and glaciers that are on land. In addition to the melting ice, seawater itself is expanding slightly, a phenomenon called thermal expansion. That higher ocean level has already put some of those reference points considerably below sea level. Presently sea level increase is small, only about a tenth of an inch a year, but eight inches over the last century. But similar to compounding interest, the cumulative effects are what we need to be concerned about. That is particularly true, because the rate of SL rise is increasing in recent decades.
Then there is the issue of local land variation, usually caused by land subsidence or uplift. Cities like New Orleans and Virginia Beach in the US, and internationally, Venice, Tokyo and Jakarta all are experiencing significant subsidence, adding to the effect of rising sea level. Jakarta is an extreme case with more than 13 feet (4 m) of SL rise since 1980.
So the reasonable question is, with the recent concern about ‘rising sea level”, which level is being referred to. Without getting too technical, it is all of them. In other words, if the global ocean is 8 inches higher, the effect in any one location tends to be that high tide, low tide, and “Mean sea level” will all rise by that amount. But when looking at building regulations, plans for a home, commercial property or infrastructure improvement, the reference point or datum for the structure heights needs to be carefully understood.
Many of the old maps are also inaccurate both due to older mapping technology and the rising ocean. The newer LIDAR maps are generally considered the standard now. Maps of flood zones in many locations are now being updated both to use the more accurate LIDAR maps and also to consider patterns of change in the historical “100 year floodplain.” A comparison in Charleston SC for example, showed a difference of up to 15 feet in height between the older maps and the new LIDAR maps.
The bottom line is that “sea level” always needs to be defined in critical situations. Sea level will now keep rising for centuries. It is unstoppable, regardless of our efforts to slow global warming. We should try to slow the warming, to keep the melting ice and rising seas from getting to catastrophic levels. As sea level rises, the shoreline will move inland. That’s the fact — as the saying goes, on the level.