
Sea Level Rise was UNDER-hyped; real story starting to emerge
Amid the politics and disappointment from the climate talks this week in Durban South Africa, there has been a little trickle of insight into the real story about sea level rise; one that even good journalists missed. The last major IPCC report on climate change was easily mis-read to say the the forecast for sea level rise this century was only about 7 – 17 inches (18 – 59 cm). Those are the numbers they put in a table; what nearly everyone overlooked was the explanation of what was NOT included in that forecast.
Those familiar with the work of the big global findings about climate change — The UN-IPCC — have been aware for four years, how they inadvertently made a huge mistake at creating a false impression about future sea level rise. Over the next few years the story will become clear. It’s a bit terrifying. The misunderstanding — or perhaps mis-representation, is quite easy to grasp, if you just know where to look, and realize what they are saying. Nearly everyone misses the big story, even though it’s rather plain to see. The best way to show this is to go to the source, which I will do in a moment.
If you are reading this, you may already understand that the widespread belief about the Arctic ice cap melting and raising sea level is incorrect. Since it is floating sea ice, it does not raise the ocean level as it melts. ( Like ice cubes floating in a glass.) In order of magnitude, starting with the largest source that will increase ocean level, over the centuries ahead:
- Melting of the Antarctic Ice Sheet
- Melting of the Greenland Ice Sheet
- Melting of the world’s glaciers
- Thermal expansion – as the ocean warms, it expands; (significant now, but limited in ultimate impact.)
 Following their established protocols, the Intergovernmental Panel on Climate Change, (IPCC) only considers objective data that has previously been published in peer-reviewed professional journals, by a cut off date determined for each of their major Assessment Reports. The 4th Report was published in 2007; the next one will be in 2012 or 13.
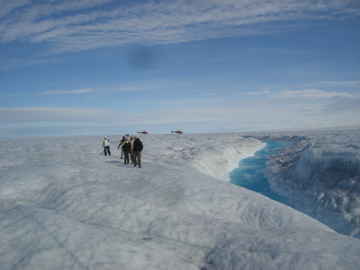
For the last decade Greenland has been melting faster and faster. Note the small river of ice water in this photo I took atop the ice sheet in 2007. Similar work has been on the cover of National Geographic Magazine. There are approximately a hundred similar streams of melt water from that ice sheet.
The rate of melt has increased so fast over the last decade that it was not possible to accurately predict how much will have melted by the end of this century — 93 years after the report.
In simple language, the line plotting the melt was moving upward so quickly, that it was “not possible to connect the dots.”
So after much negotiation — and politics — they decided to give the estimated rise in sea level only due to the current rate of melting glaciers and ice sheets, plus the thermal expansion. There is essentially no estimate for the continued increase in melt rates in Greenland and Antarctica. They decided to explain the omission with a note just above the figures, and in the text before and after the page with the table. And just to sure it was noticed, they put it near the front of the almost one thousand page book. It is on Page 13, shown below (yellow highlighting is mine):
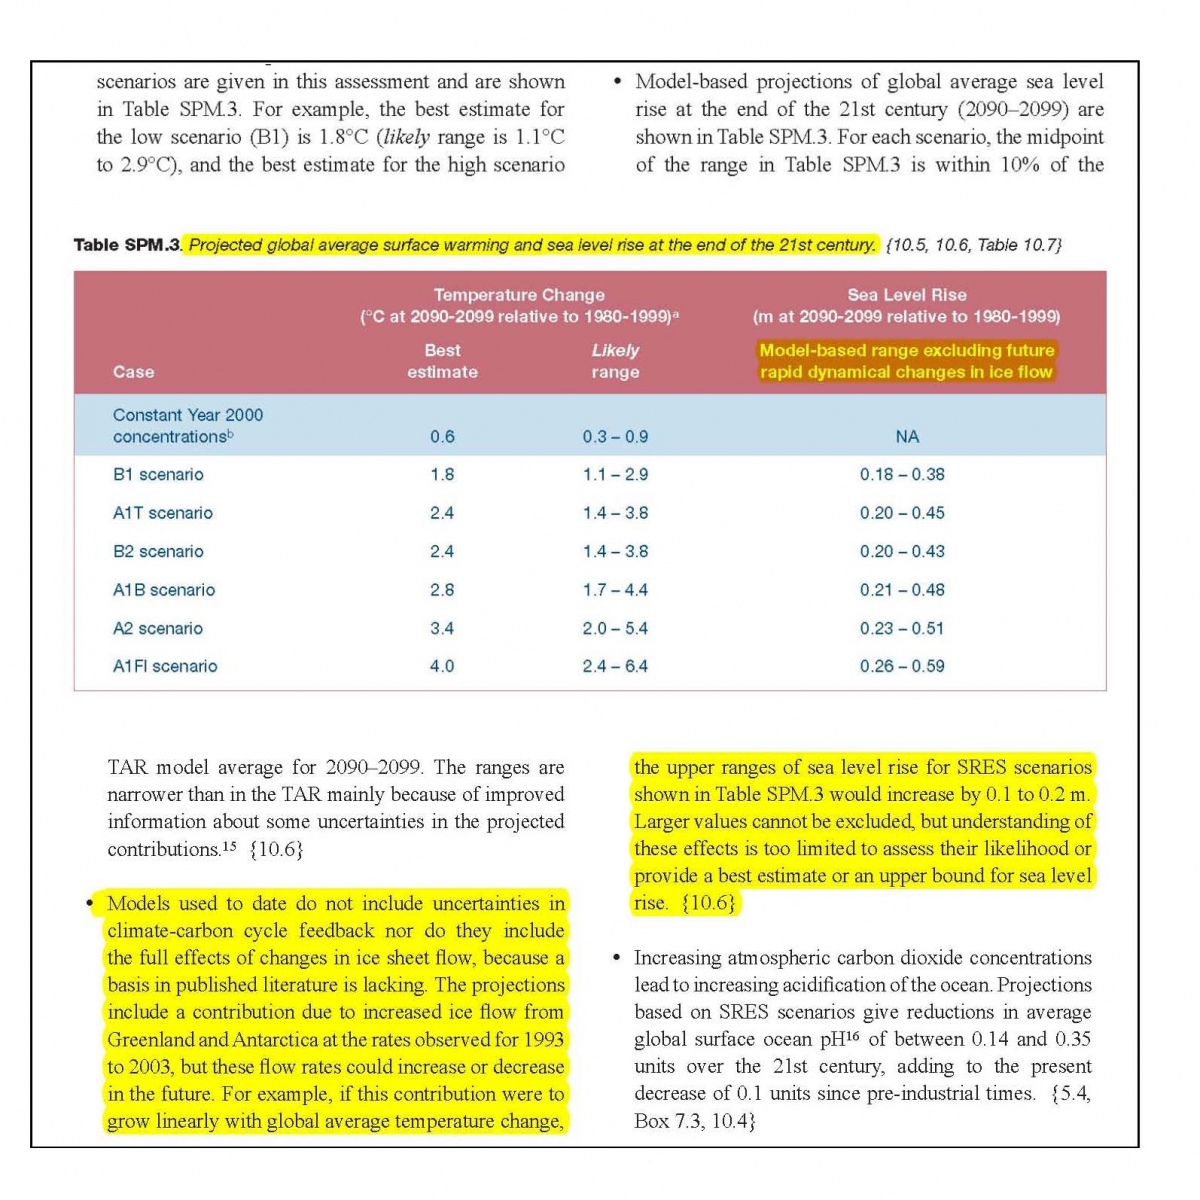
Since it is estimated that those “dynamical changes in the ice sheets” will likely account for about 90% of the melting ice, and thus sea level rise, by the end of the century, it’s highly misleading, to publish a prominent table of numbers that exclude the big contributors — the planet’s two huge ice sheets. They contain 97% of water stored above sea level, that will eventually work it’s way into the sea, as the planet warms.
The story is starting to emerge. A piece on NPR this week is a good example. http://www.theworld.org/2011/12/sea-levels-may-rise-faster-than-expected/ More to come over the next few years as more satellite data and measurements from the ice allow reasonable estimates of how much will melt over the next nine decades.
For a little deeper understanding of what realistically could happen with sea level, see my previous post, explaining why sea level will most likely rise for centuries, due to our rapidly rising levels of greenhouse gas, and the very long lag time for ice sheets to adjust to changes in average global temperature, as a result of the hundreds of years for ocean temperatures to fully adjust. One other post explained the huge range of projections — from three to sixteen feet — for sea level rise this century.
I would like to end with something light, such as ‘stock up on wading boots’ but the very real prospect of at least 4-5 feet of sea level rise this century, and then much more in the next, is just so devastating that it is difficult to make fun of it. Hopefully it will not be too many more years, before the realistic projections change the debate.
Look for the next big IPCC report in 2012 or 13. The challenge is that even then, we will not quite have the really good projections for the melt rate acceleration in Antarctica. Nonetheless, I trust they will better communicate what the new numbers include, and what they do not.