
Places where sea level rose from 4 to 46 inches last century
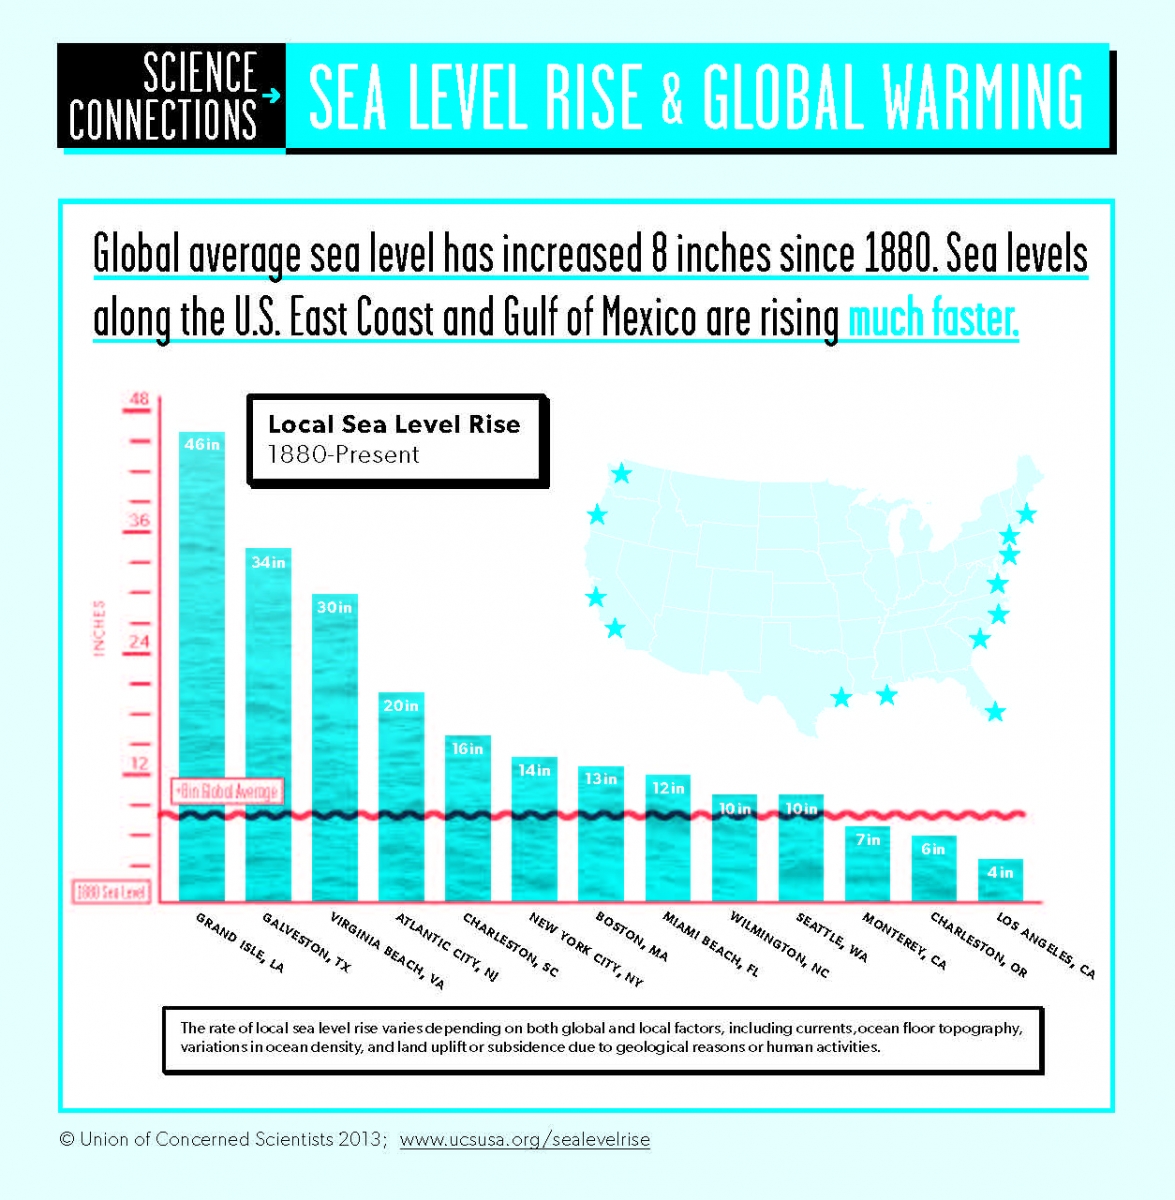
Over the last century sea level rise has been almost 8 inches (20 cm) as a global AVERAGE. One might assume that sea level would be the same everywhere, adjusting for waves, storms, and tides. Not true.
Surprisingly the amount of sea level rise varies considerably.
In some places it has increased by more than three feet. In others just four inches. A range of US locations is shown on this clear graphic from the Union of Concerned Scientists.
The primary reason for the difference is that the reference viewpoint is the nearest land mass. Land moves up and down, known as “uplift” or “subsidence.” In other words, sea level appears to change relative to the nearby land. If sea level rises 3 inches and the land subsides (lowers) 2 inches, sea level rise in that location would be five inches.
In places where land is subsiding or sinking, SL rise will be greater. Examples shown are Grand Isle, Louisiana, near New Orleans on the high end, and Los Angeles California on the low end. California is generally on the low end since the west coast plate is rising fractions of an inch. In the coming decades the increased rate of SL rise will most likely overwhelm the rate of land rise.
In Alaska sea level appears to be going down because the land is rising faster than sea level, though not shown on this chart. In the decades ahead it is quite clear that the melting ice sheets will produce even greater sea level rise (SLR) overcoming even the rate at which Alaska is rising.
This graphic comes from the Union of Concerned Scientists. There are three other slides in the series that are also worth checking out. They have made the full set of four available for free download. You may wish to use them. They are designed for general audiences.