Amazing NASA Photo Shows Our Thin Atmosphere
Last week I was at NASA Headquarters to give a technical presentation about sea level projections to the Interagency Forum on Climate Risks, Impacts, and Adaptation. On one of the walls, I saw this striking Earth 
The curved white line is the troposphere, the lowest layer of the atmosphere, from the Earth’s surface up to 7 miles, or 39,000 feet (12 km). The troposphere contains 80% of the mass of our atmosphere. Clouds, weather phenomena, and commercial aviation all occur in this layer. Above that is the much less dense stratosphere and other layers, up to the boundary with the vacuum of outer space, usually considered to be 62 miles (100 km) above Earth’s surface.
Another way to put the atmosphere’s thickness in perspective is to look at a common physical globe representing the planet. If there is a plastic coating on the globe, that is roughly the thickness of the atmosphere in proportion to the globe.
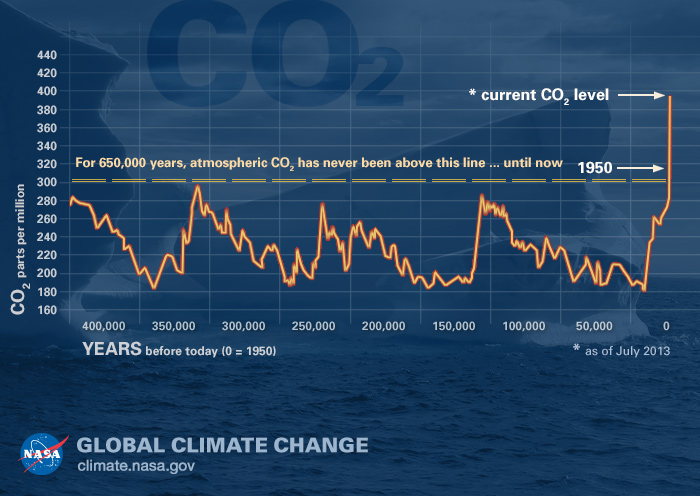
Perhaps that thinness makes it easier to accept that human activity can alter its composition and characteristics. We have already warmed the oceans and atmosphere roughly one degree Celsius, or almost two degrees Fahrenheit, with 93% of the extra heat being stored in the oceans. Primarily that correlates with the increase of carbon dioxide (CO2) now well over 400 parts per million (PPM), about 40% higher than at any time in the last ten million years. CO2 was demonstrated to be a heat-trapping “greenhouse gas” by John Tyndall in 1859 as part of his pioneering atmospheric research at the Royal Institution in London. The NASA graphic below shows the dramatic change in heat-trapping CO2.
It surprises many to learn that the NASA team includes many climate scientists and oceanographers. They correlate the satellite measurements with glaciologists analyzing the ice cores from Antartica, which contains the record of hundreds of thousands of years of CO2 levels frozen in the ice sheets as depicted on the graph below. With the natural cycle, CO2 had a regular pattern up and down about every hundred thousand years, ranging from 180 – 280 PPM. Since 1950 the CO2 level has gone straight up trapping more heat in that relatively thin atmospheric boundary. That extra CO2 ties in with the burning of fossil fuels.
NASA’s 60th Anniversary was proudly on full display, as shown in this commemorative poster below. In the six decades since NASA’s ‘launch’ in October 1958, the technologic advances made possible by them and their partner agencies has profoundly changed our knowledge about the universe and our home planet. That knowledge is an amazing gift and testimony to our intellectual capacity and instinct to discover the facts about our existence. I can’t avoid commenting that it remains to be seen, whether we are capable of acting on the knowledge we have learned.


