Featured in NY TIMES Major Climate Article
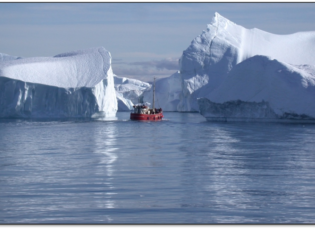
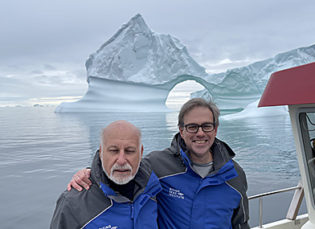
The New York Times just published a comprehensive article on climate change in Friday’s online version, in which I am prominently featured. The author of this excellent article on climate change and Greenland’s melting glaciers is the pre-eminent NY Times columnist Bret Stephens. The genesis ...
October 29th, 2022 Category: Sea Level Rise