
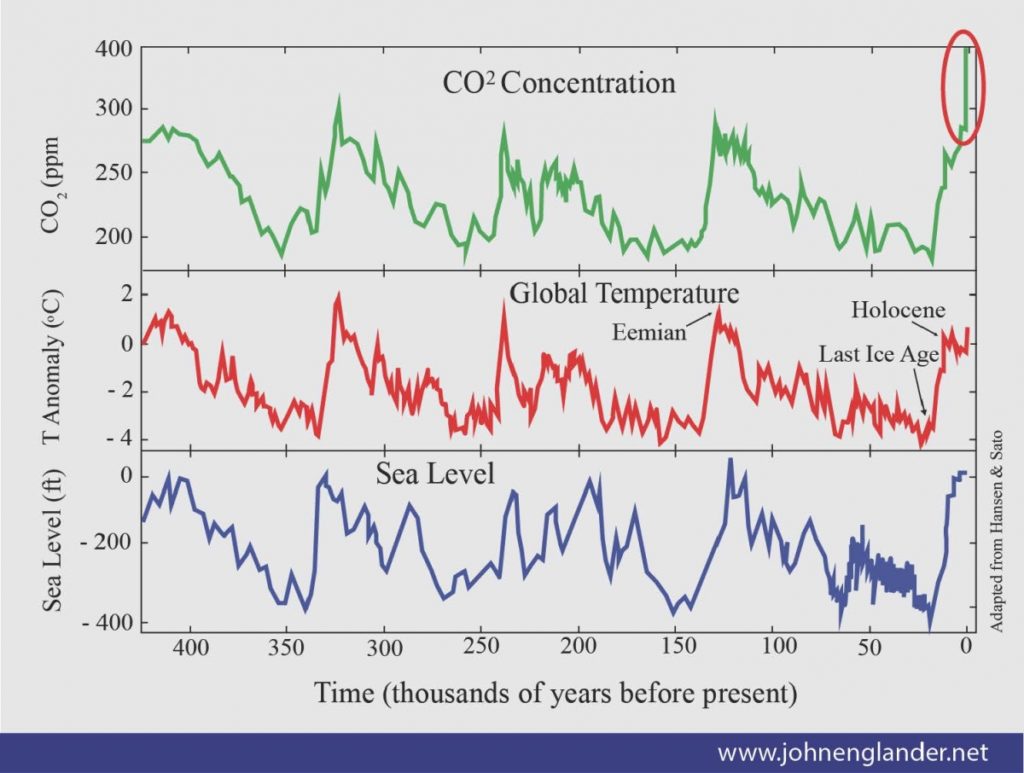
The above chart shows the relative changes in global average temperature, CO2 (carbon dioxide), and sea level over the last 420,000 years. At the bottom of this page, there is a link to download a PDF of this graph – which may be used on the condition that it is presented as is, WITHOUT MODIFICATION.
The data is derived from different sources that corroborate and confirm the findings. Data sources include air bubbles trapped in layers of the ice sheets in Greenland and Antarctica; isotopes of oxygen that are temperature markers; isotope markers of diverse elements in layers of deep ocean sediments; ancient coral reefs and speleothems; salt marsh core samples; and physical evidence of ancient shorelines, above and below the present. (The chart is based on the work of Dr. James Hansen and Makiko Sato who greatly assisted in this representation.)
The graph shows 4 major ice ages, on a cycle of roughly 100,000 years. The last ice age peak was just over 20,000 years ago. At that time sea level was almost 400 feet (120 m) below the present due to the huge quantity of water locked up in the ice sheets more than a mile deep over North America and Europe.
The other very interesting sea level event was approximately 120,000 years ago, during the previous “interglacial” — the warm period between ice ages — like our present era. In that last interglacial (known as the Eemian to geologists) the temperature was a few degrees warmer than at present, but sea level rose about 26 feet (8 m) higher than present, possibly even a little higher.
With our present warming trend that higher sea level is a major concern due to the catastrophe it would present to coastal cities and infrastructure globally. Because our warming is now happening a lot faster than previous periods of natural abrupt climate change, there is no way to accurately predict how many years it will take for enough ice to melt to raise the ocean that much.
The real big issue of concern is the level of CO2. As shown on the green line in the middle, it has fluctuated between about 180 – 280 ppm (parts per million) over this period of time. It very closely moves with temperature. Now the level has shot up like a rocket to 400 ppm, a 40% increase. This correlates with our emissions from burning fossil fuels, reduction of forest cover, and other factors.
If temperatures later this century continue to climb, causing all the ice sheets to eventually melt, there will be even greater problems. The last time that CO2 levels were in the range near a thousand, was about 55 million years ago. At that time there were no polar ice sheets and sea level was approximately 250 feet (75 m) higher than today.
While sea level and climate have changed in the past, it was LONG before our human civilization. Normally climate changes happen over hundreds of thousands of years or longer. Even abrupt natural changes take thousands of years. Once the ice melts and sea level rises, there is no known way to reverse the process quickly.