SPIEGEL missed explaining wide range of 3-16 ft SLR forecasts
The July 17 German Spiegel Online has a really good article about the challenge and very diverse spread of forecasts for sea level rise this century. “UN Climate Body Struggling to Pinpoint Rising Sea Level.” As the author Axel Bojanowski accurately surveys, there are diverse credible sources that would easily lead one to believe that the rise by the end of century could be as little as 1 meter (3 feet), or as high as 5 meters (16 feet).
Wow – how do you reconcile or plan around that and what does it say about the accuracy of the science? It is worth a little explanation. As you may know this is a subject that I have studied for the last two years as part of the book I am writing on the same subject (book info).
There are three points that I think he neglected to mention that may help to understand how the forecasts could be so diverse:
Point #1 – In support of his mention that NASA scientist Dr. James Hansen’s recently suggested that SLR by end of century could be much higher than other forecasts — regardless of the exact figure mentioned of a possible 5 meters — is the idea that the melting ice on the planet is accelerating, beyond linear, at some level of geometric progression that is not yet reflected in the models.

As you can see the models keep getting better, but are not yet totally accurate. Yet we must not ignore the good, while waiting for the perfect. It should be noted that while the melting Arctic sea ice does not add to sea level rise (like floating ice cubes in a glass), it is an indicator of what will happen to the ice sheets on Greenland, Antarctica, and the glaciers, all of which do directly add to global sea level.
Point #2 – The melt rates in Greenland and Antarctica are changing very quickly. When points don’t go in a straight line, or even a smooth curve, it is difficult to plot 90 years into the future with certainty. That is the reason that the last UN-IPCC report had to simply leave the numbers out of their projection — creating the mistaken impression that they only thought sea level would rise 18-59 cm (7 – 17 inches). While climate modelers in different countries are working on different but similar ways to do the projections, it is worth noting that the US modeling group, does not expect to even include the melt rates for Greenland and Antarctic in their projections until 2013, which means that information will still not be included in the next UN-IPCC report scheduled to be released that same year. Thus even the next big report will be deficient.
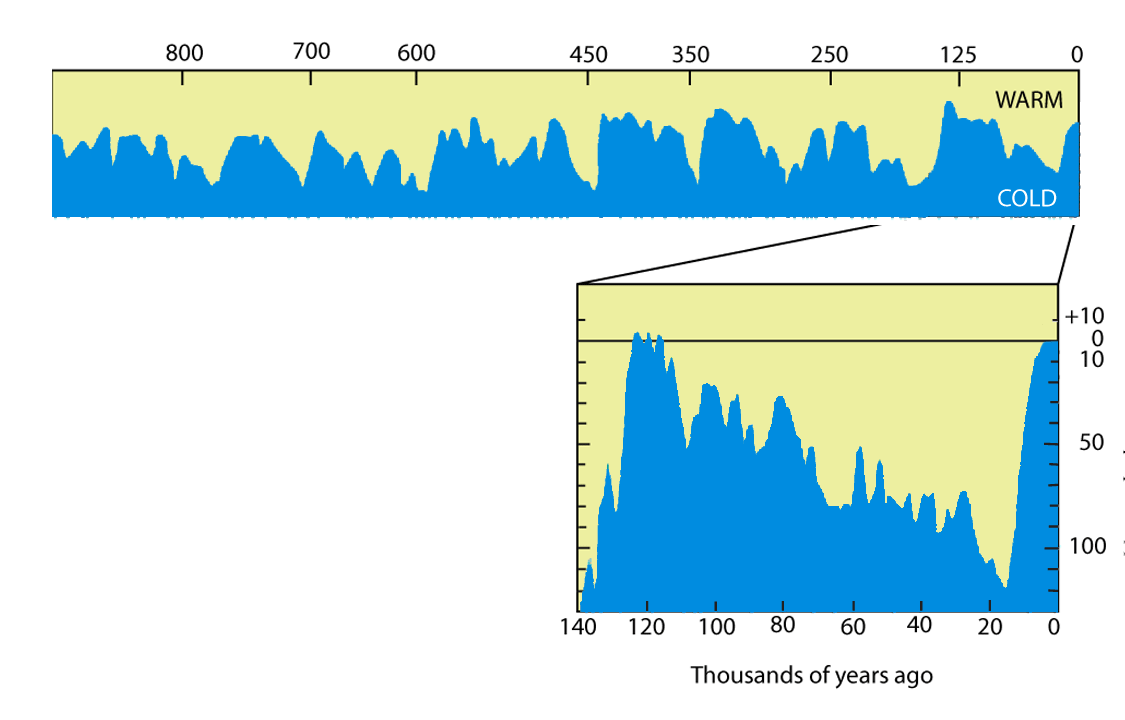
Point #3 – The most challenging thing to keep in mind when trying to understand claims, and counterclaims about climate is timescale and the rate of change. Except for those who study geology, most people tend to be unaware that sea level has changed over 100 meters (330 feet) at regular intervals for the last 3 million years — in synch with the periodic ice ages. 
We were fooled into thinking SL does not change much as it changed little in the last 6,000 years, while our civilization developed.
While climate has changed many times in history, and dramatically:
a) it has been VERY stable for the last 10,000 years during the Holocene, and
b) the rate of warming during the last century has been 20,000 times faster than the last known period of abrupt natural change — 65 million years ago.
The faster rate of warming and the fact that it was so long ago, makes it very challenging to predict precisely — and hard for us to believe.
If one looks at the big picture, the geologic history says that OVER A LONG ENOUGH PERIOD OF TIME, that sea level adjusts about 20 meters (65 feet) for every degree Celsius of global temperature change, and we have already had about 0.8 degrees C of change over the last century. It could take centuries for the adjustment. We simply cannot know precisely since it has never happened in the last 125,000 years, and the Earth has never warmed this rapidly. Given that, it is understandable that there are variances in the short term projections. It does not mean the science is bad. It is a bit like asking a doctor how long someone with an illness has to live. If the doctor said, “Hard to tell — could be three months or three years — hard to say for sure.” We would not question his ability of the medical profession in general.
The fact is that our future can be seen in geologic history, even though we have trouble seeing it, or being willing to believe it; something psychologists call cognitive dissonance — that’s a subject for another time.
