
420,000 years of Temp, CO2, and sea level – What a Coincidence
This chart shows the relative changes in global average temperature, CO2 (carbon dioxide), and sea level over the last 420,000 years. The data is derived from different sources that corroborate and confirm the findings. Data sources include air bubbles trapped in layers of the ice sheets in Greenland and Antarctica; isotopes of oxygen that are temperature markers; isotope markers of diverse elements in layers of deep ocean sediments; ancient coral reefs and speleothems; salt marsh core samples; and physical evidence of ancient shorelines, above and below the present. The chart is adapted from the work of Dr. James Hansen and Makiko Sato. PDF of this graph is available for download on this page (in English or metric versions).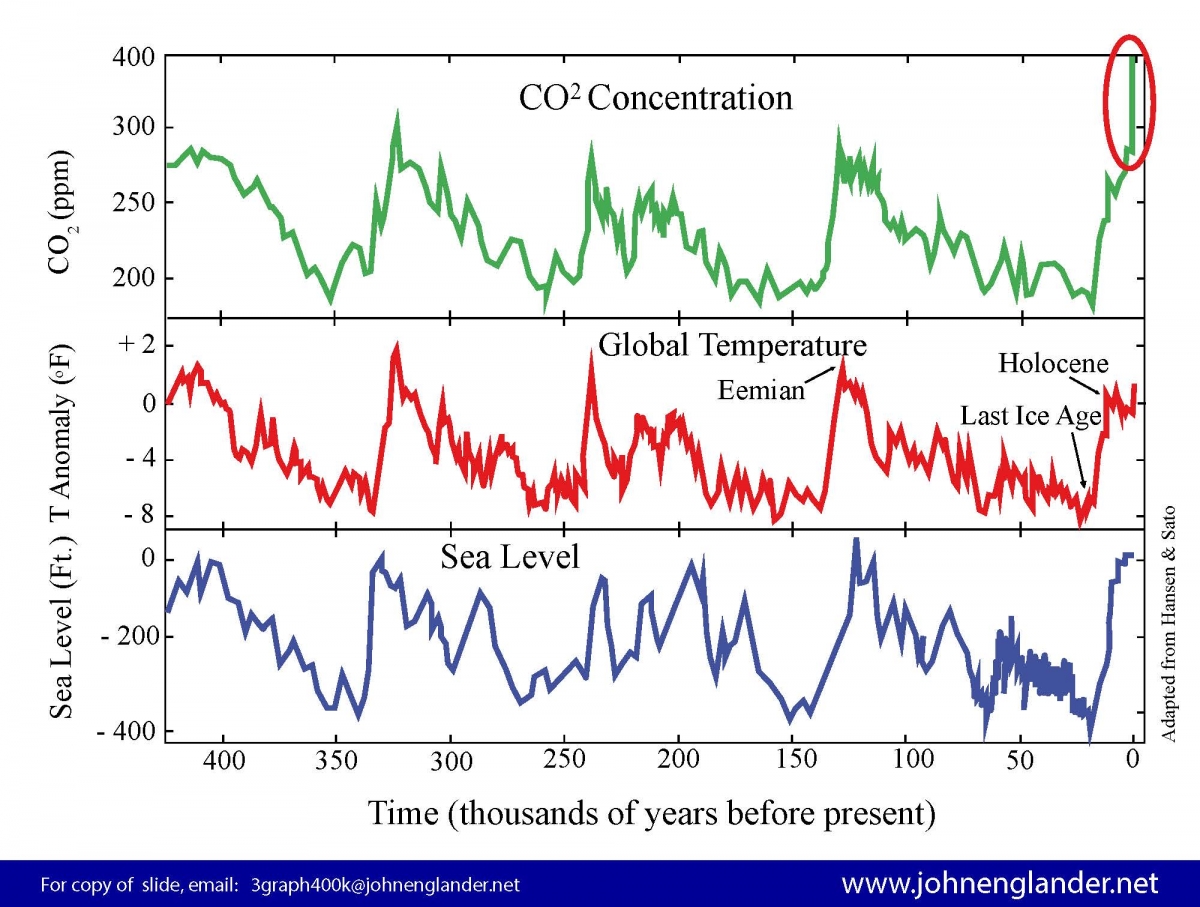
This ‘big picture’ view does not give any insight into years or decades. What it can do is give a better perspective. Much of the current evidence, and arguments of the doubters, rests on data from a few years, which can be confusing. This rather clear parallel movement of temperature, CO2 and sea level provides a powerful story. Over a long period of time, THEY MOVE IN UNISON, just what one would expect with CO2 being a heat-trapping greenhouse gas, and warmer temperature melting the ice sheets, raising sea level.
The graph shows 4 major ice ages, on a cycle of roughly 100,000 years. The last ice age peak was just over 20,000 years ago. At that time sea level was almost 400 feet (120 m) below the present due to the huge quantity of water locked up in the ice sheets, more than a mile deep over North America and Europe.
The other very interesting sea level event was approximately 120,000 years ago, during the previous “interglacial” — the warm period between ice ages. We are presently in an interglacial. In that last interglacial (known as the Eemian to geologists) the temperature was a few degrees warmer than at present. Research over the last few years indicates that sea level rose about 26 feet (8 m) higher than present, possibly even a little higher.
Over the last century we have warmed almost two degrees F and are headed to much greater increases over the course of this century. Warmer temperatures are associated with higher CO2 levels. Warmer temperatures mean increased melting of the polar ice sheets and raising sea level. This presents a major concern due to the catastrophe that several feet of higher sea level would cause to coastal cities and infrastructure globally. Because our warming is now happening a lot faster than previous periods of natural abrupt climate change, there is no way to accurately predict how many years it will take for enough ice to melt to raise the ocean that much.
The real big issue of concern is the level of CO2. As shown on the green line in the middle, it has fluctuated between about 180 – 280 ppm (parts per million) over the last 400,000 years. Now the level has shot up like a rocket to 393 ppm, a 40% increase. (Note the line goes way up into the area of the red graph.) This correlates with our emissions from burning fossil fuels, reduction of forest cover, and other factors. The concern is the way that average global temperature moves in concert with CO2.
If temperatures later this century continue to climb, causing all the ice sheets to eventually melt, there will be catastrophe — even if it takes many centuries for that to fully happen. The last time that CO2 levels were in the range near a 1,000 ppm, was about 55 million years ago. At that time there were no polar ice sheets and sea level was approximately 250 feet (75 m) higher than today.
While sea level and climate have changed in the past, it was LONG before our human civilization. Normally climate changes happen over hundreds of thousands of years or longer. Even abrupt natural changes take thousands of years. Once the ice melts and sea level rises, there is no known way to reverse the process quickly. That presents a huge problem, nothing short of a catastrophe, for our civilization over the next few centuries. The problems could start sooner than we think.
There is another problem with high CO2 besides sea level rise. Paleontologist Dr. Peter Ward of the University of Washington has assembled a picture of all the known mass extinction events over the last 500 million years. The correlation with CO2 levels is a stunner. To be covered in my next post.